

Every AI takeoff vendor claims 94–99% accuracy. Almost none of those numbers have been checked by anyone outside the company that published them. It’s the same pattern we’ve run into looking at confident round numbers in AI: generally the more absolute the figure, the more worth asking who measured it. I went looking for the tests that were run by someone else, and the gap between the demo reel and your actual drawing set turned out to be exactly where most buying mistakes happen..
This isn’t a vendor roundup. It’s what independent and trade-press testing has actually measured, separated from the marketing, plus a four-step method you can run on your own plans before spending a cent.
AI takeoff is a genuine speed multiplier and a conditional accuracy tool. It’s strong on clean vector plans and repetitive symbol counting. It falls apart on scanned sheets, dense MEP, and anything with unusual geometry. And that one number everyone quotes as proof of near-human accuracy? It came from a test that handed the software a BIM model, not the same task as reading a flat PDF.
What the tests actually measure
Real-world accuracy on a first pass lands between 80% and 95%, depending heavily on drawing quality and trade. That’s well below vendor claims, and well above the “it just doesn’t work” dismissal you’ll find on estimator forums.
The honest range, from people who actually run these tools: 90–95% on clean, native-vector residential plans; 80–90% on commercial work; lower still on hand-drawn, scanned, or MEP-heavy sheets. Trade coverage generally agrees, though it frames the numbers slightly differently — vendors quote 95–99% on clean vector plans, with the real figure sliding into the 80s and low 90s once scans, dense annotation, or overlapping trades enter the picture.
Same reality, described two ways. Accuracy isn’t a property of the software. It’s a property of the software plus your drawing set.
The six-platform benchmark and the catch that changes how you read it


The most-cited comparative test in this space ran in February 2026, from Robotics & Automation News. Six AI estimating platforms got the same project pack: 200+ plan sheets, multi-discipline specs, a small Revit model, a stack of addenda. A team of senior quantity surveyors built the ground truth by hand first, checking every line for concrete, steel, MEP, and finishes.
What came out of it:
- InEight Estimate led on accuracy, landing at 1.8% total error against the hand-built baseline.
- Togal.AI finished a full architectural takeoff in twelve minutes, needing only a handful of manual fixes on an oddly shaped closet.
- Beam AI matched Togal’s turnaround on human hours and posted the second-lowest miss rate.
- STACK, Procore Estimating, and Kreo filled out the middle, each winning at least one category.
Here’s the part that gets dropped whenever that 1.8% gets quoted: the test pack included a BIM model alongside the drawings. BIM comes with quantities and materials already tagged. Pulling numbers out of tagged geometry is a much easier problem than inferring them from pixels on a marked-up PDF with no model behind it.
That’s editorial framing, not a flaw in the test itself — but it’s the difference between a benchmark result and a prediction about your workflow. If your bid packages show up as scanned PDFs with nothing else attached, 1.8% isn’t the number to plan your review time around. It’s also a trade publication’s test, not a peer-reviewed one — the best public data we have, which isn’t quite the same as definitive.
Where AI holds, and where it breaks
Performance swings more by drawing type than by vendor. Here’s the pattern that shows up consistently across independent testing and estimator accounts:
| Drawing condition | Typical AI performance | Review level needed |
|---|---|---|
| Standard walls, floors, areas (vector PDF) | High (90–95%) | Spot-check |
| Repetitive symbol counting | High (90%+) | Spot-check, verify exceptions |
| Complex or curved geometry | Medium to low | Full review |
| Dense MEP and structural | Low | Full review |
| Low-quality scans, hand markups | Low | Full review |
The vector-versus-raster split tends to surprise first-time buyers most. These engines are built for clean linear measurement and simple borders — that’s the sweet spot. Scanned raster sheets and hand markups still run, but expect more misses and budget the time to check them closely.
Speed is the proven win; accuracy is the conditional one
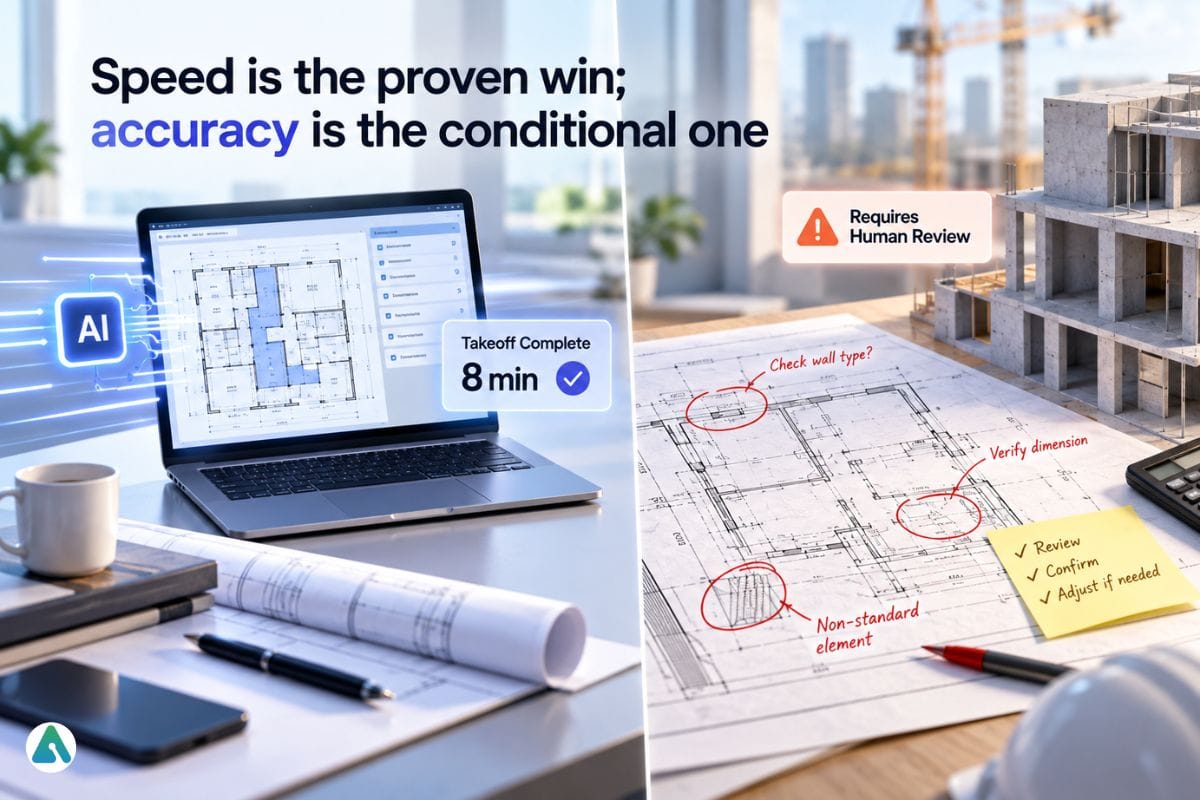

Time savings hold up across nearly every account I’ve read, which isn’t true of the accuracy claims. Most AI takeoffs finish in 5 to 30 minutes against 4 to 8 hours manually — a 70–90% cut in measurement time on residential work, less dramatic on commercial where review takes longer regardless.
ConstructConnect frames the shift well: every takeoff method produces mistakes under deadline pressure, AI included. The real change is spending less time checking routine quantities and more time on the parts of the estimate that actually carry risk.
That’s the real business case, not the accuracy number. You’re not buying a correct figure — you’re buying back hours and putting them into scope review, addenda reconciliation, and bid strategy instead.
The visual reasoning gap, and why it matters here
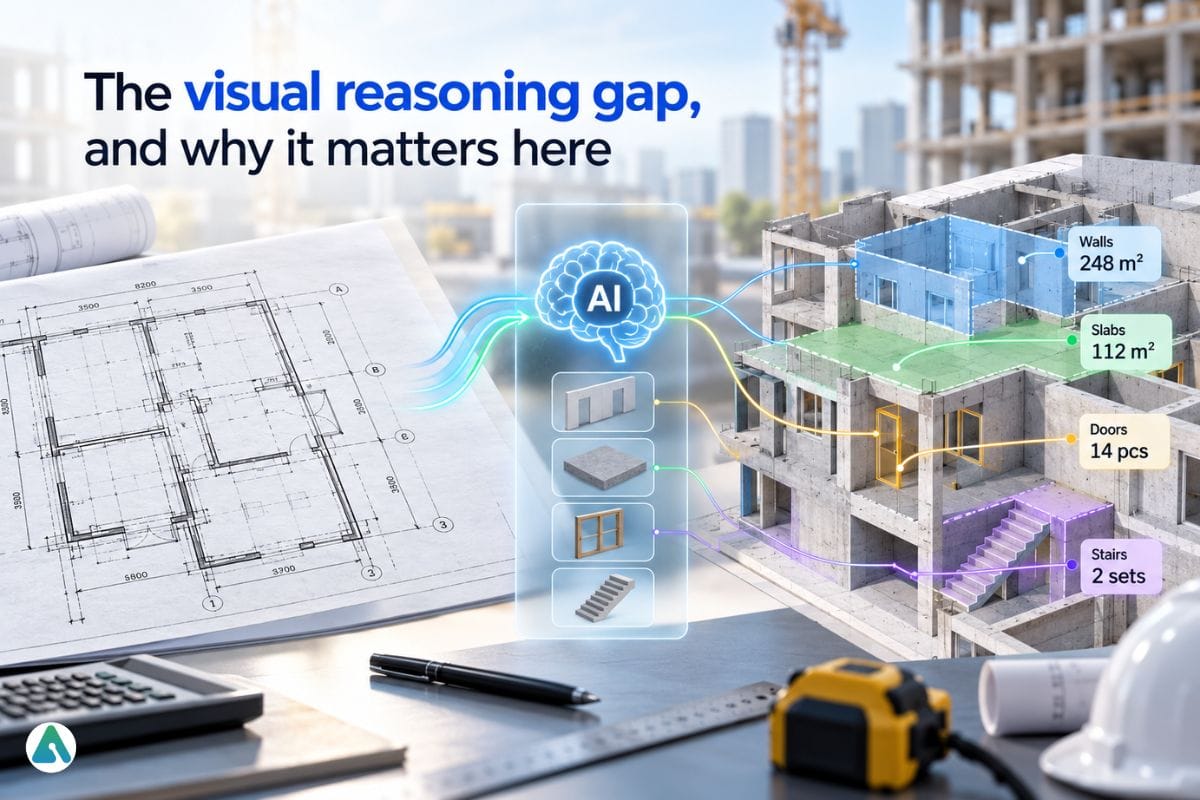

There’s a useful outside check on how AI systems handle spatial reading: ClockBench, a benchmark that just asks models to read an analog clock face. Trivial for a person, and it demands exactly the kind of angular, spatial reasoning that reading a drawing does.
Stanford’s 2026 AI Index has the top model at 50.6% on this test, against 90.1% for humans. When ClockBench first launched, the gap was far worse scored 89.1%, while the best model managed 13.3%, with weaker models missing by roughly three hours on a 12-hour dial. We’ve written about this kind of gap between benchmark headlines and what the numbers actually show before it’s a pattern worth keeping in mind whenever a vendor leads with a single accuracy figure.
Two things follow, and they pull in opposite directions. First: the gap is real. Models keep confusing visually similar components — the hour hand for the minute hand, most often — and on a drawing, that’s the same failure mode behind mistaking a dimension line for a wall. Second: it’s closing fast. Going from 13% to 50%+ in about a year is a steep curve. Anyone telling you AI can’t learn to read drawings is arguing against a trend line that isn’t cooperating. Anyone telling you it already reads them like a senior estimator is arguing against this quarter’s score.
Five mistakes I keep seeing buyers make
The pattern is familiar: the accuracy number in the marketing rarely matches what users actually see in the field.
- Testing on the vendor’s demo files. Clean by construction. Tells you the ceiling, not your floor.
- Treating one accuracy number as a property of the tool. A vendor’s 98% on commercial floor plans says nothing about your messy residential renovation set — and vice versa.
- Measuring accuracy without measuring review time. A 95%-accurate tool whose output you can’t audit line-by-line can cost more in verification than it saves in measurement.
- Ignoring trade fit. Platforms are tuned to segments — Togal leans commercial and has reported gaps on electrical; a residential-trained tool tells you nothing about a 14-package mixed-use bid.
- Skipping the addenda test. Most demos use a static plan set. Real bids get revised mid-cycle, and how a tool handles a changed sheet matters more than its first-pass score.
A four-step test you can run yourself
Takes about a day. Produces a number that actually applies to your work, not the vendor’s.
Step 1. Pick three historical projects with hand-verified quantities already in hand — one clean vector set, one scanned or marked-up set, one dense in your primary trade. Don’t build the ground truth during the test; you need it going in.
Step 2. Run each platform cold. No vendor assistance, no custom config. Upload, adjust basic settings, run — this is how your team will actually use it in week one.
Step 3. Score three things separately: quantity variance by trade, time to first output, and time to verified output how long your estimator needs to audit the result before trusting it. That third number is the one vendors never publish, and it’s the one that decides your ROI.
Step 4. Revise a sheet and rerun it. See whether the tool updates only the affected quantities or forces a full re-run.
If a platform can’t clear a variance threshold you’d accept from a junior estimator on your clean set, the scanned set won’t save it.
Which trades see the weakest results
MEP stays the consistent problem child — mechanical and plumbing need trade-specific element recognition that general-purpose engines handle poorly, and electrical is where several commercial-focused platforms have reported gaps. Structural reinforcement detail sits in the same bucket: dense, overlapping, heavy on convention that isn’t visually obvious.
Architectural floor plans, sitework, concrete, drywall, and roofing tend to perform best — scopes built on area, linear measurement, and repeated symbols.
What you can actually hand over
Three things hold up across every credible test I’ve looked at:
- Time savings are real and large — 70–90% on measurement tasks.
- Accuracy tracks your drawings, not your vendor. Clean vector gets 90–95%; scans and dense MEP get meaningfully less.
- The judgment doesn’t transfer. Scope intent, addenda relevance, waste factors, constructability — all still yours.
The honest mental model is a fast, tireless junior who counts accurately and understands nothing. You still own the number you submit.
Run the four-step test on your own historical projects before you buy. A day spent doing that beats every vendor benchmark you’ll ever read — including this one.
FAQs
Q. How accurate is AI takeoff software in 2026?
Roughly 90–95% on clean vector plans, 80–90% on commercial work, lower and more variable on scans, hand markups, or MEP-dense sheets. Vendor figures of 95–99% are self-reported and mostly unverified by neutral parties.
Q. Has anyone independently tested AI takeoff software?
Yes, though there’s not much of it. The most-cited comparative test ran six platforms against a hand-built QS baseline on 200+ sheets, with the top performer at 1.8% total error — but that pack included a Revit model, which makes extraction easier than a flat PDF.
Q. Can AI takeoff replace a human estimator?
No. It replaces measurement time, not judgment. Scope interpretation, addenda reconciliation, waste factors, and bid risk stay human work.
Q. Does AI takeoff work on scanned PDFs?
It runs, but accuracy drops. OCR dependency and geometric ambiguity creep in. Plan on full review, not spot-checking, for any scanned set.
Q. Which trades get the worst AI takeoff accuracy?
MEP and detailed structural reinforcement — dense, overlapping, and reliant on conventions a vision model can’t see directly.
Q. Why do vendor accuracy claims differ so much from field results?
Vendors test on ideal conditions — clean CAD exports, complete plan sets, proper scale notation. Field sets bring scans, markups, and revision clouds. The number isn’t dishonest, just measured under conditions your bids rarely meet.
Q. How should I test AI takeoff accuracy myself?
Three historical projects with verified quantities, run cold with no vendor help, scored on quantity variance, time to first output, and time to verified output — then one addendum revision to see how the tool handles change.
Related: 6 Leading AI Software Factory Vendors for Enterprise Engineering
| Disclaimer: Accuracy figures and test results cited here vary by software, drawing quality, trade, and testing method. Vendor claims are not treated as universal results. Always test AI takeoff software on your own plans before relying on it for estimates or bids. |
